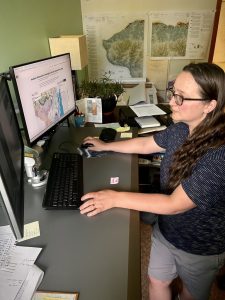
Mel Reusche, WGNHS Communications and outreach specialist speaking with WGNHS Cartographer and GIS Specialist Caroline Rose
Over the last two years, WGNHS cartographer Caroline Rose has explored ways to make spatial data—like geologic maps—accessible and useable for readers who are visually impaired or can’t engage with a printed map. Funded by an Innovation Grant from the University of Wisconsin–Madison Division of Extension, Caroline and collaborators worked to produce an interactive version of the recent WGNHS publication Quaternary Geology of Wisconsin that pushes the envelope of accessibility for digital maps. Explore this innovative product and read on to hear from Caroline about this exciting project!
The UW Innovation Grant was established to foster innovations that develop and apply advancements in human knowledge and/or promote economic prosperity in Wisconsin. What was the motivation behind this project?
In alignment with the Wisconsin Idea, at the state geological survey, we provide scientific research to benefit all residents of the state of Wisconsin, and we need to ensure that information can reach all people who would benefit from that work. Graphical information such as the maps produced by the WGNHS pose a challenge to readers with visual or print disabilities, who can’t see the map.
I titled my Innovation Grant application “Beyond Alt Text” because current guidelines for accessibility of map graphics tend to rely on text descriptions (alt text) and providing any data as a table.
A geologic map shows detailed patterns of natural features which do not correspond to a table of counties or zip codes. For maps like these, any text description is a limiting portrayal.
I chose to focus the project on the statewide map of the Quaternary geology of Wisconsin because I knew it would be of interest to a wide audience. It is also a complex map that illustrates several well-known geologic stories from around the state.
I wanted to make maps like this one more accessible, but I had never seen that done before. This project gave me the opportunity to figure out what might be possible: if someone could not see or read the map, in what other possible ways could I convey its contents, including the shapes, arrangement, groupings, and so on. I can’t anticipate every use of this map, so the larger goal is for future users of this accessible map to be able to explore the information and answer their own questions.
Trying something new can be quite a learning process, how did this project evolve over the last two years?
I learned a lot through the process of researching and working on this grant project and, luckily, could evolve the project as it progressed.
I started by seeking examples of maps that incorporated some element of accessibility, which was also an opportunity to connect with people working in the field. I wrote many emails to introduce myself to people who were connected to accessibility. Although I am also fascinated by tactile maps, I knew it was important to prioritize digital distribution.
I sought out examples of digital accessibility for maps or for other complex data structures to look for anything that might allow someone to navigate and understand the information in a geologic map without having to see it. From the beginning of the grant, I was working with accessibility researcher Frank Elavsky and his accessibility-focused tool Data Navigator, which is tailored for graphs and charts; however, it wasn’t specifically designed to work with geographic data formats.
I had been reaching out to people and organizations for several months when I was finally connected to XR Navigation and their CEO and co-founder Brandon Biggs. They have been developing an accessibility-focused web map platform called Audiom.
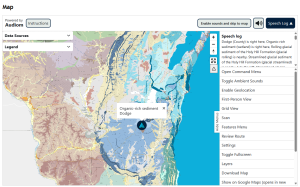
They were able to work with my map data in the GIS format that we already use, allowing us to leverage existing map workflows. The result is a map that users navigate with an avatar to hear audio representations of the geologic features encountered along with descriptive text that goes into more detail about any particular feature.
What are you most proud of regarding this project? Do you have any advice for others working to make map materials more accessible?
As a result of this grant, we have a very impressive demonstration of a complex map-based publication that is keyboard-navigable and screen-reader-friendly through the Audiom-based maps and the Data Navigator-based charts and diagrams.
It represents years and years of work and expertise invested in the original scientific work, the traditional cartographic work, the development of the Audiom and of Data Navigator platforms, and the efforts to braid all of this together.
Thanks to those collaborations, the resulting map is beyond what I imagined.
If this project can generate interest, energy, and enthusiasm to propel other work to improve map accessibility, that would be the best outcome. Although it may seem intimidating to solve the many challenges to accessibility of visualizations, it’s a fascinating area to be working in.
My advice to anyone working to improve digital accessibility is to take a deep breath and then get started.
More Information
For more details, contact one of the following WGNHS staff members:
- Caroline Rose, caroline.rose@wisc.edu
- Mel Reusche, mel.reusche@wisc.edu